Homework · Day 2
Bar Chart — Household Spending in Two Countries
What you'll do tonight
- Read the bar chart data summary below.
- Plan briefly: what are the biggest differences between the two countries?
- Write a 150+ word Task 1 report in 20 minutes.
- Use at least 2 passive structures and at least 3 comparison structures ("whereas", "compared with", "higher/lower than") from yesterday's work.
- Submit your work.
Task 1 prompt
Write at least 150 words.
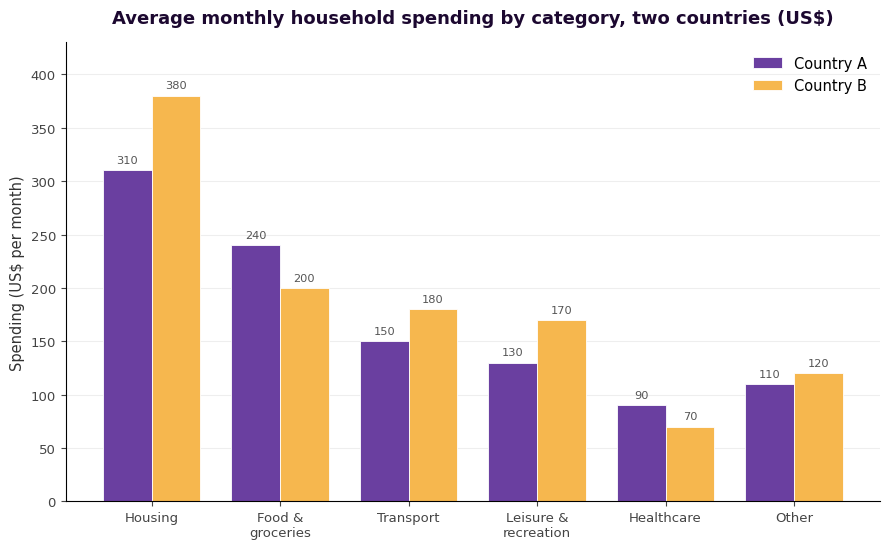
| Category | Country A (US$) | Country B (US$) |
|---|---|---|
| Housing | 310 | 380 |
| Food & groceries | 240 | 200 |
| Transport | 150 | 180 |
| Leisure & recreation | 130 | 170 |
| Healthcare | 90 | 70 |
| Other | 110 | 120 |
Big-picture comparison: Housing is the largest single expense in both countries, but Country B spends more on it ($380 vs $310). Country A spends more only on food & groceries ($240 vs $200) and healthcare ($90 vs $70); Country B spends more on transport, leisure and other. The gaps are widest for housing and leisure.
Exercise 1 — Quick plan
Which category is the largest expense in both countries?
In which categories does Country A spend more than Country B?
What overall comparison does this chart show?
Exercise 2 — Vocab to use
- Amounts: "spent", "accounted for", "the largest/smallest amount", "around $X", "just under/over $X"
- Comparison: "higher/lower than", "compared with", "whereas", "while", "by contrast", "roughly twice as much as"
- Similarity: "broadly similar", "almost the same", "comparable to"
- Passive structures: "More was spent on housing in Country B", "A larger amount was allocated to leisure"
Exercise 3 — Your 150+ word report
Your Task 1 report
Target: 150+ wordsExercise 4 — Self-check
- ☐ 150+ words →
- ☐ Paraphrased introduction (didn't copy prompt) →
- ☐ Clear overview (no numbers) →
- ☐ At least 2 passive structures →
- ☐ At least 3 different comparison structures →
- ☐ No opinions ("unfortunately", "this is good") →
Exercise 5 — Band 8 model answer
Reveal only after finishing your report.
Word count: ~165
The bar chart compares the average amount of money, in US dollars, that households in two countries spent each month across six categories.
Overall, housing was the single largest expense in both countries, and spending patterns were broadly similar, although Country B generally spent more, particularly on housing and leisure, whereas Country A spent more only on food and healthcare.
Housing accounted for the highest outlay in each country, although a larger amount was spent in Country B, at $380 compared with $310 in Country A. Food and groceries were the second-biggest category, but here the pattern was reversed: households in Country A spent $240, whereas those in Country B spent only $200. Country B also spent more on transport ($180 against $150) and noticeably more on leisure and recreation ($170 compared with $130). The two countries were closest on the "other" category, at $120 and $110 respectively. Healthcare attracted the least spending overall, and was the one remaining area where Country A's figure ($90) exceeded Country B's ($70).
Comparison structures used: compared with, whereas, against, more than, the pattern was reversed, respectively.
Passive structures used: "a larger amount was spent", "the highest outlay was recorded", "the least spending was attracted".
Free practice resources
Extra free practice for tonight — each link opens in a new tab. These are free online resources (no purchase needed); a few may ask you to create a free account.
-
Line Graph / Trend Vocabulary →
IELTS Liz
Trend verbs/nouns/adverbs + gap-fill. ~20 min, free.
-
Bar Chart Model + Tips →
IELTS Liz
Model answer and tips for comparing groups in a bar chart. ~15 min, free.
Ready to submit?
Use the "Submit work" button inside the writing box, then pick Copy, Gmail, Outlook or your mail app.